Debugging a Plug-in
When a Plug-in Extension is not working, it is necessary to debug it. The sections explain how to debug a C# plug-in or a VB plug-in.
Debugging a C# Plug-in Extension
Debugging a VB Plug-in Extension
Note: You should only debug a plug-in on a non-production machine. Real-time plug-in updates are disabled when debugging takes place. For example, deleting or replacing a plug-in that’s in the watch directory is not supported while in debug mode.
Debugging a C# Plug-in Extension
|
Steps |
|
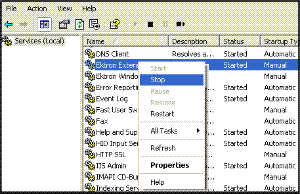
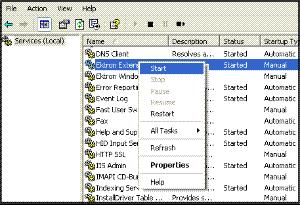
1. Navigate to Start > Control Panel > Administrative Tools > Services and stop the Ektron Extensibility Server.
|
|
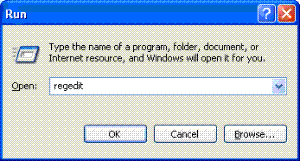
2. Run Regedit by clicking Start > Run and typing regedit in the Open text box. Next, click OK.
|
|
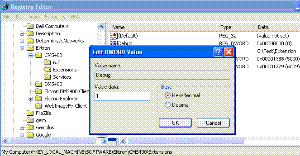
3. Change the entry HKEY_LOCAL_MACHINE\SOFTWARE\Ektron\CMS400\Extensions\Debug to 1. Use either Hexadecimal or Decimal.
|
|
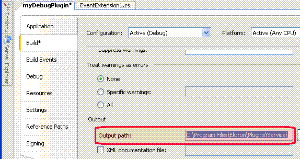
4. In Visual Studio, right click on the project in the Solution Explorer and select properties. Next, click the Build tab change the Output path of the plug-in so it builds in the service directory. This is the directory that has the ExtensionService.exe in it. The default install location is C:\Program Files\Ektron\Plugins\Service\.
|
|
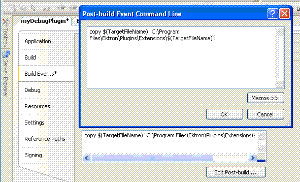
5. Copy the built plug-in to the watch folder via the Post-build step on the Build Events settings page. The default install location is C:\Program Files\Ektron\Plugins\Extensions.
|
|
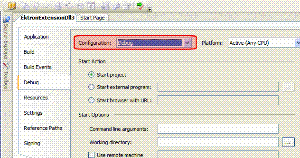
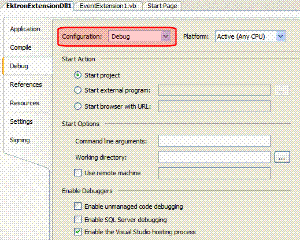
6. On the Debug tab, change Configuration to “Debug” and build the plug-in.
|
|
7. Start the Ektron Extensibility server.
|
|
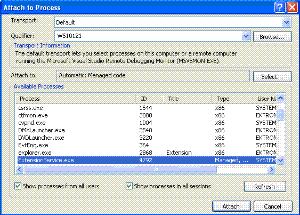
8. In Visual Studio, click Debug > Attach to Process or <Ctrl>+<Shift>+<R>. Next, click the ExtensionService.exe process, then click the Attach button. Warning! : If you do not see the ExtensionService.exe, make sure that Show processesfrom all users and Show processes in all sessions are checked.
|
|
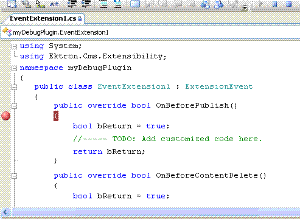
9. Set the breakpoint(s) in the plug-in where debugging is to take place.
|
|
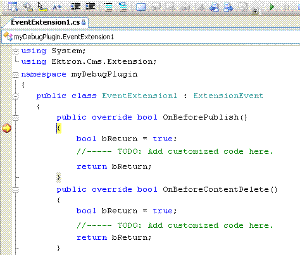
10. Execute the action within the CMS to trigger the event. For the example breakpoint below, publish a piece of content. The breakpoint is hit as shown below.
|
Debugging a VB Plug-in Extension
|
Steps |
|
1. Navigate to Start > Control Panel > Administrative Tools > Services and stop the Ektron Extensibility Server.
|
|
2. Run Regedit by clicking Start > Run and typing regedit in the Open text box. Next, click OK.
|
|
3. Change the entry HKEY_LOCAL_MACHINE\SOFTWARE\Ektron\CMS400\Extensions\Debug to 1. Use either Hexadecimal or Decimal.
|
|
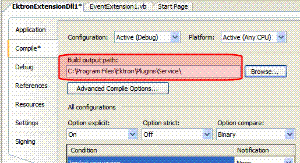
4. In Visual Studio, right click on the project in the Solution Explorer and select Properties. Next, click the Compile tab change the Build Output path of the plug-in so it builds in the service directory. This is the directory that has the ExtensionService.exe in it. The default install location is C:\Program Files\Ektron\Plugins\Service\.
|
|
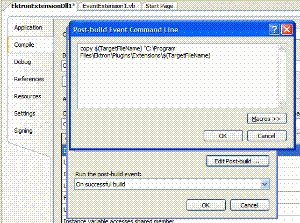
5. Copy the built plug-in to the watch folder via the Post-Build event. On the Compile tab, click the Build Events... button. Next, click the Edit Post-build... button. Enter the following information and click OK. copy $(TargetFileName) "C:\Program Files\Ektron\Plugins\Extensions\$(TargetFileName)
|
|
6. On the Debug tab, change Configuration to “Debug” and build the plug-in.
|
|
7. Start the Ektron Extensibility Server.
|
|
8. In Visual Studio, click <Debug > Attach to Process or <Ctrl>+<Shift>+<R>. Next, click the ExtensionService.exe process, then click the Attach button. Warning! If you do not see the ExtensionService.exe, make sure that Show processesfrom all users and Show processes in all sessions are checked.
|
|
9. Set the breakpoint(s) in the plug-in where debugging is to take place.
|
|
10. Execute the action within the CMS to trigger the event. For the example breakpoint below, publish a piece of content. The breakpoint is hit as shown below.
|
