| |
Pre-Kindergarten Through Grade 2 |
Standards |
 |
4.1 Creating, Describing, and Analyzing Patterns— mobile-ready
This two-part e-example encourages students to use
visualization, spatial reasoning, and geometric modeling to build their own
patterns or recreate one from given square arrays.
|
Algebra
|
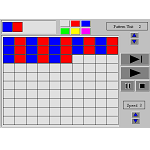 |
4.1.1 Making Patterns (Java)
Includes an interactive figure for creating, comparing, and viewing multiple repetitions of pattern units.
|
Algebra |
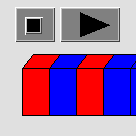 |
4.1.2 Describing Patterns (Java)
Gives examples of various ways students might interpret the same sequence of cubes. These differences illustrate the importance of discussing and analyzing patterns in the classroom. |
Algebra |
 |
4.2 Investigating Geometry Concepts on GeoBoards
This two-part e-example presents a virtual 11x11
pin grid and triangular grid where students can explore geometric shapes and
measurements with the option of shading
areas, hiding pegs, deleting segments, and moving vertices.
|
Geometry
|
.png) |
4.2.1 Making Triangles (Java)
Focuses attention on the concept of triangle, helping students understand the mathematical meaning of a triangle and the idea of congruence, or sameness, in geometry.
|
Geometry
|
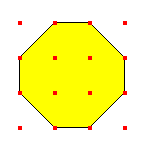 |
4.2.2 Creating Polygons (Java)
Students make and compare a variety of polygons, describing the salient properties of the shapes they create.
|
Geometry |
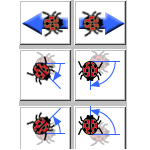 |
4.3.1 Hiding Ladybug (Java)
Students create a path that enables the ladybug to hide under a leaf.
|
Geometry
Problem-Solving |
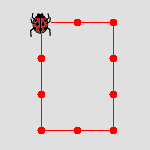 |
4.3.2 Making Rectangles (Java)
Students plan the steps necessary for the ladybug to draw rectangles of different sizes.
|
Geometry
Problem-Solving |
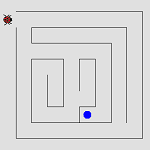 |
4.3.3 Ladybug Mazes (Java)
Students plan a series of moves that take the ladybug through a maze.
|
Geometry
Problem-Solving |
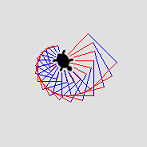 |
4.3.Extension Learning Geometry and Measurement Concepts by Creating Paths and Navigating Mazes (Java)
Write short programs using computer languages.
|
Geometry
Problem-Solving |
 |
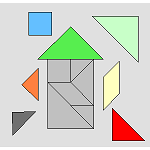
4.4 Developing Geometry Understandings with Tangrams
In this two-part e-example, students choose from eight
pre-made outlines and use either seven or fourteen pieces to create images and
build basic geometric understandings. The options include the ability to:
color, rotate, show hints, time progress, and create your own outlines.
|
Geometry
Problem-Solving
|
 |
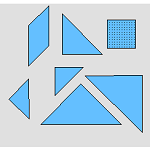
4.4.1 Tangram Puzzles (Java)
Students can choose a picture and use all seven pieces to fill in the outline.
|
Geometry
Problem-Solving |
 |
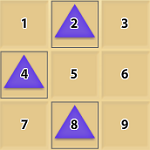
4.4.2 Tangram Challenges (Java)
Students can use tangram pieces to form given polygons.
|
Geometry
Problem-Solving |
 |
4.5 Learning about Number Relationships
Students can find and create up to four number patterns in
this two-part e-example by using a calculator or by shading in values in
rectangular grids up to a value of 100.
|
Number and Operations
Reasoning and Proof
Communication
|
 |
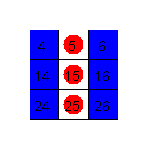
4.5.1 Displaying Number Patterns (Java)
The same patterns are displayed on a calculator and on a hundred board simultaneously.
|
Number and Operations
Reasoning and Proof
Communication
|
 |
4.5.2 Patterns to 100 and Beyond (Java)
Students examine number patterns, using a calculator to move beyond 100.
|
Number and Operations
Reasoning and Proof
Communication
|
 |
4.6.1 Estimating Scoops (video)
The teacher presents an estimation task (estimate the number of scoops of cranberries in a jar) to the second-grade students and talks about the teaching decisions she is making.
|
Connections |
 |
4.6.2 Discussing Strategies (video)
The students work in groups to share their ideas and reach a reasoned consensus about their estimates.
|
Connections |
 |
4.6.2a Discussing Strategies Extension (video)
In this video segment, consider how this estimation activity provides an opportunity for the student with Down's Syndrome to participate.
|
Connections |
 |
4.6.3 Estimating Cranberries (video)
Students estimate the number of cranberries rather than the number of scoops.
|
Connections |
| |
Grades 3–5
|
Standards |
 |
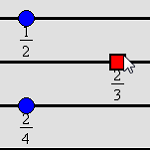
5.1 Playing Fraction Track
In this two-player e-example, students take timed turns
racing to the end of each fraction line by moving one or more of their markers
to sum to a given fraction value. Options include a pass and restart button.
|
Communication |
 |
5.1.1 Playing Fraction Track (Java)
An interactive version of a game (based on the work of Akers, Tierney, Evans, and Murray 1998) that can be used in the grades 3–5 classroom to support students' learning about fractions. By working on this activity, students have opportunities to think about how fractions are related to a unit whole, compare fractional parts of a whole, and find equivalent fractions, as discussed in the Number and Operations Standard.
|
Communication
|
 |
5.1.2 The Role of the Teacher (video)
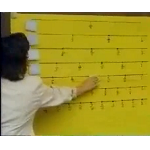
Two video clips illustrate communication about mathematics among a teacher and her students.
|
Communication |
 |
5.1.3 Communication among Students (video)
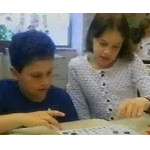
Shows how activities like this allow students to use communication as a tool to deepen their understanding of mathematics, as described in the Communication Standard.
|
Communication |
 |
5.1.4 Reflecting on Practice (video)
The teacher reflects on her own mathematical learning that occurs as a result of using activities like this game with her 5th-grade students.
|
Communication |
 |
5.2 Understanding Distance, Speed, and Time
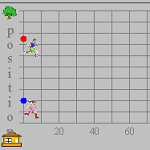
This two-part e-example uses two runners with variable
starting points and speeds in order to find the relationship between time and
distance. Use the puzzle mode to manipulate speed in order to follow the pace
of a fellow runner.
|
Algebra |
 |
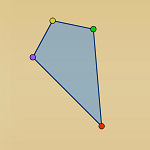
5.2.1 Using the Runners App (Java)
This example includes a software simulation of two runners along a track. Students can control the speeds and starting points of the runners, watch the race, and examine a graph of the time-versus-distance relationship. The computer simulation uses a context familiar to students, and the technology allows them to analyze the relationships more deeply because of the ease of manipulating the environment and observing the changes that occur.
|
Algebra |
 |
5.3 Exploring Properties of Triangles and Quadrilaterals
This e-example allows students to observe the properties of
triangles and quadrilaterals by manipulating the sides, angles, and type.
|
Geometry |
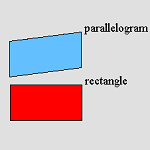 |
5.3.1 Exploring Properties of Rectangles and Parallelograms Using Dynamic Software (Java)
Dynamic geometry software provides an environment in which students can explore geometric relationships and make and test conjectures.
|
Geometry |
 |
5.4 Accessing and Investigating Data Using the World Wide Web
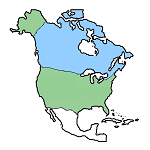
This example describes activities in which students can use census data available on the Web to examine questions about population. Working on such activities, students can also formulate their own questions and use the mathematics they are studying to address these questions. They can propose and justify conclusions that are based on data and design further studies on the basis of conclusions or predictions, as described in the Data Analysis and Probability Standard.
|
Data Analysis and Probability |
 |
5.5.1 Collecting and Examining Weather Data (Java)
Students organize and then examine data that has been collected over a period of time in a spreadsheet.
|
Representation |
 |
5.5.2 Representing and Interpreting Data (Java)
Students use the graphing functions of a spreadsheet to help them interpret data.
|
Representation |
| |
Grades 6-8
|
Standards |
 |
6.1 Understanding Multiplication Using Dynamic Sketches of an Area Model
Students are encouraged to build conceptual reasoning for
multiplying decimals by manipulating an area model.
|
Number and Operations |
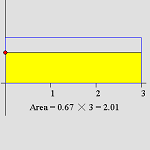 |
6.1.1 Learning about Multiplication Using Dynamic Sketches of an Area Model (Java)
Students can learn to visualize the effects of multiplying a fixed positive number by positive numbers greater than 1 and less than 1 with this tool.
|
Number and Operations |
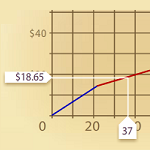 |
6.2 Cost per Minute
Explore a linear function or a piecewise function comparing units
vs. cost per unit in order to find the total cost of a phone plan.
|
Algebra
|
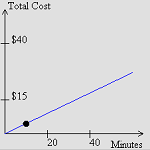 |
6.2.1 Constant Cost Per Minute (Java)
Explore the total cost when the cost per minute for phone use remains constant over time.
|
Algebra |
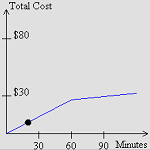 |
6.2.2 Changing Cost Per Minute (Java)
Explore the total cost when the cost per minute for phone use changes after the first sixty minutes of call.
|
Algebra |
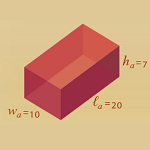 |
6.3 Investigating
Connections between Measurements and Scale Factors of Similar Figures
Using this two-part e-example helps students find the
relationships that exist within the ratio of perimeter and area (or surface
area and volume) of two similar figures. Options for variability include
changing the scale factor and type of figure.
|
Geometry
|
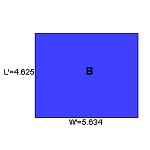 |
6.3.1 Side Length and Area of Similar Figures (Java)
The user can manipulate the side lengths of one of two similar rectangles and the scale factor to learn about how the side lengths, perimeters, and areas of the two rectangles are related.
|
Geometry |
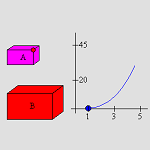 |
6.3.2 Side Length, Volume, and Surface Area of Similar Solids (Java)
The user can manipulate the scale factor that links two three-dimensional rectangular prisms and learn about the relationships among edge lengths, surface areas, and volumes.
|
Geometry |
 |
6.4.1 Visualizing Transformations (Java)
Choose a transformation and apply it to a shape to observe the resulting image.
|
Geometry |
 |
6.4.2 Identifying Unknown Transformations (Java)
The user is challenged to identify the transformation that has been used.
|
Geometry |
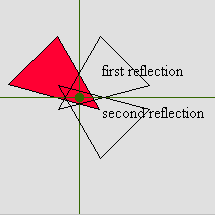 |
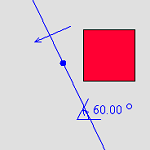
6.4.3 Composing Reflections (Java)
Examine the result of reflecting a shape successively through two different lines.
|
Geometry |
 |
6.4.4 Composing Transformations (Java)
Users are challenged to compose equivalent transformations in two different ways.
|
Geometry |
 |
6.5 Understanding the
Pythagorean Relationship
This e-example provides a proof without words for the
Pythagorean Theorem.
|
Geometry
|
 |
6.6 Comparing Properties of the Mean and the Median through the use of Technology
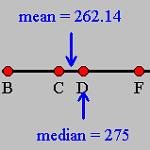
Using interactive software, students can compare and contrast properties of measures of central tendency, specifically the influence of changes in data values on the mean and median. As students change the data values, the interactive figure immediately displays the mean and median of the new data set.
Experimenting with this software helps students compare the utility of the mean and the median as measures of center for different data sets, as discussed in the Data Analysis and Probability Standard.
|
Data Analysis and Probability |
| |
Grades 9-12
|
Standards |
 |
7.1.1 Components of a Vector (Java)
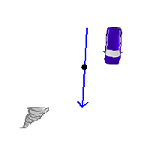
Students develop an understanding that vectors are composed of both magnitude and direction.
|
Number and Operations |
 |
7.1.2 Sums of Vectors and Their Properties (Java)
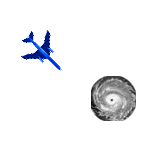
Students extend their knowledge of number systems to the system of vectors.
|
Number and Operations |
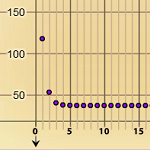 |
7.2 Using Graphs, Equations, and Tables to Investigate Iteration and Recursion
In this e-example, students are able to iterate up to 100
times after defining their own initial value and recursive function.
|
Algebra
|
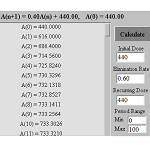 |
7.2.1 Modeling the Situation (Java)
An interactive environment is used to become familiar with the parameters involved and the range of results that can be obtained.
|
Algebra
|
 |
7.2.2 Long-Term Effect (Java)
The interactive environment is used to investigate how changing parameter values affects the stabilization level of medicine in the body.
|
Algebra |
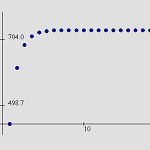 |
7.2.3 Graphing the Situation (Java)
An interactive graphical analysis provides a visual interpretation of the results.
|
Algebra |
 |
7.3 Understanding Ratios
of Areas of Inscribed Figures Using Interactive Diagrams of Polygons
Explore the relationship between the inner and outer areas
of inscribed polygons in this e-example by rotating a polygon within itself. Options
include four different polygons along with the capability to move vertices.
|
Connections
Geometry
|
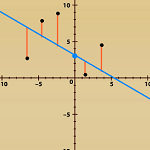 |
7.4 Understanding
Best-fit with a Visual Mode: Measuring Error in a Linear Model
Use this e-example to minimize the error in a line of best
fit by toggling between four different measuring methods. Options include the
ability to change the location of five points and the ability to rotate and translate
the line of best fit.
|
Data Analysis
and Probability
|
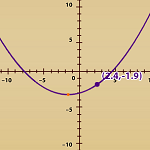 |
7.5 Representational
Relationships of Lines and Parabolas
This two-part e-example allows for students to explore the
effect of coefficients and constants within linear and quadratic functions.
Options include the ability to the change the forms of equations and trace the
graphs.
|
Problem Solving
|